
A boring look into my Spotify playlist
Let's jam out

Sit tight and listen to music
For the past weeks, I’ve taken breaks from staring blankly into the middle distance to dip deeper into my playlists than I have in years.
I’ve been using Spotify only since last year since most of time I used apple music. I like the feature of adding songs to library on apple music. By innertion I’m still using the library to save songs that I like. After moving apple music library to Spotify, I nerded out to see how my playlist looks under Spotify’s standard. All code can be found here.
Preparation
To get the data I used Spotify API and spotipy as a Python client. After creating a web application in Spotify API Dashboard and gathering the credentials, I was able to initialize and authorize the client.
import spotipy
import spotipy.util as util

user_id = 'your user_id'
client_id= 'your client_id'
client_secret= 'your client_secret'

token = util.prompt_for_user_token(user_id,
                                   scope = 'user-top-read playlist-read-collaborative',
                                   client_id=client_id,
                                   client_secret=client_secret,
                                   redirect_uri= redirect_uri) # arbitrary url you put in while registering in Spotify API
sp = spotipy.Spotify(auth=token)
Recent top songs
So here I’m gonna pull up my most played tracks in the last 4 weeks.
if token:
    sp = spotipy.Spotify(auth=token)
    artist_shortterm = []
    song_shortterm = []
    results = sp.current_user_top_tracks(time_range='short_term', limit=50)
   """
   time_range: long_term (calculated from several years of data), medium_term (approximately last 6 months), short_term (approximately last 4 weeks)
    """
    for i, item in enumerate(results['items']):
        song_shortterm.append(item['name'])
        artist_shortterm.append(item['artists'][0]['name'])

pd_top50 = pd.DataFrame({'track':song_shortterm, 'artist':artist_shortterm })
pd_top50.sample(12)
| track | artist |
|---|---|
| What I Got | Sublime |
| Lovesong | The Cure |
| Heart-Shaped Box | Nirvana |
| Just Like Honey | The Jesus and Mary Chain |
| Gigantic (live) | Pixies |
| The Diamond Sea | Sonic Youth |
| Hey | Pixies |
| Schizophrenia | Sonic Youth |
| Feel Good Inc. | Gorillaz |
| Psycho Killer | Talking Heads |
| Lamb Of God | Marilyn Manson |
| Smelly Cat Medley | Phoebe Buffay And The Hairballs |
Get audio features of song tracks
As everything is inside just one playlist, it was easy to gather. The only problem was that user_playlist method in Spotipy doesn’t support pagination and can only return the first 100 track, but it was easily solved by adding condition of while more_songs
def get_features_from_playlist(user='', playlist_id=''):
    df_result = pd.DataFrame()
    track_list = ''
    added_ts_list = []
    artist_list = []
    title_list = []

    more_songs = True #As long as there is tracks not fetched from API, continue looping
    offset_index = 0

    if playlist_id != '' and user == '':
        print("Enter username for playlist")
        return

    while more_songs:
        songs = sp.user_playlist_tracks(user, playlist_id=playlist_id, offset=offset_index)

        for song in songs['items']:
            track_list += song['track']['id'] +','
            added_ts_list.append(song['added_at'])
            title_list.append(song['track']['name'])
            artists = song['track']['artists']
            artists_name = ''
            for artist in artists:
                artists_name += artist['name']  + ','
            artist_list.append(artists_name[:-1])

        track_features = sp.audio_features(track_list[:-1])
        df_temp = pd.DataFrame(track_features)
        df_result = df_result.append(df_temp)
        track_list = ''

        if songs['next'] == None:
            more_songs = False
        else:
            offset_index += songs['limit']
            print('Progress: ' + str(offset_index) + ' of '+ str(songs['total']))

    #add the timestamp added, title and artists of a song
    df_result['added_at'], df_result['song_title'], df_result['artists'] = added_ts_list, title_list, artist_list
    return df_result
A glimpse of my playlists
get all my playlist:
user_playlists = sp.user_playlists(user='lalala')

for playlist in user_playlists['items']:
    print(playlist['id'], playlist['name'])
id1 TUNE
xx2 Sonic Youth Radio
xx3 Driving
xx4 Kickkkk
...
First column is playlist id, second is the name of my playlists.
Let’s dive into my quarantine playlist ‘TUNE’ 🙌
playlist = sp.user_playlist(user_id, 'what ever id1 is')
tracks = playlist['tracks']['items']
next_uri = playlist['tracks']['next']
for _ in range(int(playlist['tracks']['total'] / playlist['tracks']['limit'])):
    response = sp._get(next_uri)
    tracks += response['items']
    next_uri = response['next']

tracks_df = pd.DataFrame([(track['track']['id'],
                           track['track']['artists'][0]['name'],
                           track['track']['name'],
                           parse_date(track['track']['album']['release_date']) if track['track']['album']['release_date'] else None,
                           parse_date(track['added_at']))
                          for track in playlist['tracks']['items']],
                         columns=['id', 'artist', 'name', 'release_date', 'added_at'] )
Top artists
The first vanilla idea was the list of the most appearing artists in my playlist:
tracks_df.groupby('artist').count()['id'].reset_index().sort_values('id', ascending=False).rename(columns={'id': 'amount'}).head(10)
| Artist | amount |
|---|---|
| Sublime | 20 |
| Dire Straits | 18 |
| The Cure | 13 |
| BANKS | 12 |
| Radiohead | 11 |
| Pink Floyd | 11 |
| Oasis | 11 |
| Eminem | 11 |
| Nirvana | 11 |
| Gorillaz | 11 |
Audio features of song tracks
Spotify API has an endpoint that provides features like danceability, energy, loudness and etc for tracks. So I gathered features for all tracks from the playlist. I don’t have years of records on Spotify so it’s difficult to check how my taste has changed over years. 🤷♀️
Getting sad?
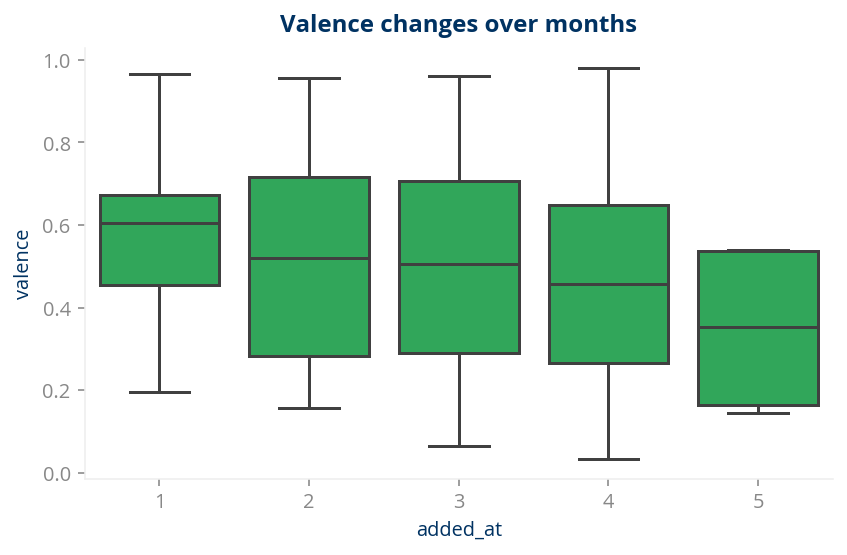
So I looked at if my music habits changes under lockdown. It turns out only Valence had some visible difference:
Valence: A measure from 0.0 to 1.0 describing the musical positiveness conveyed by a track. Tracks with high valence sound more positive (e.g. happy, cheerful, euphoric), while tracks with low valence sound more negative (e.g. sad, depressed, angry).
Ahh. Lockdown unleashed my sadness just like the old saying from me ‘Depression feels like my 30-pound dog is sitting on my chest’.
Kidding. I luuuuuv my dog!!
plt.figure(figsize=(6,4))
sns.boxplot(x=df_2020.added_at.dt.month, y=df_2020.valence, color='#1eb954')
plt.title("Valence changes over months", fontsize=12,y=1.01,weight='bold')
plt.show()
Have moves?
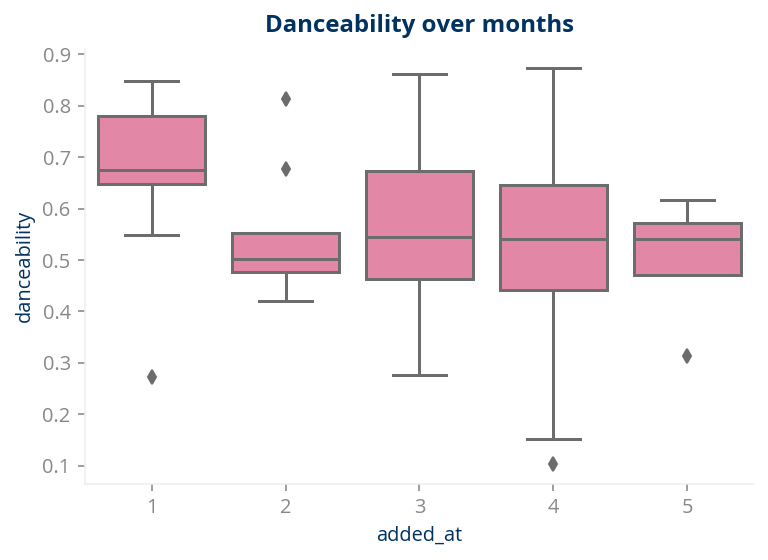
Huh? I have no words. This is a shame to someone who has 100% danceability!!!
To get my head around the loss of my danceability, let’s check if my sadness has anything to do with the dancing!
tracks_w_features.plot(kind='scatter', x='danceability', y='valence')
plt.title("Danceability x Valence", fontsize=12, y=1.01,weight='bold')
plt.tight_layout()

Hmm. Interesting. So apperantly my playlist doesn’t show the positive correaltion between ‘upbeating’ and ‘danceable’. :thinking:
Let’s just say I’ve tried to be chipper under quarantine, because I’m afraid that if there’s one crack, I’ll fall apart completely.
How different and similar among songs?
I took those features out and calculate the distance between every two different tracks. (matrix production)
encode_fields = ['danceability', 'energy', 'key', 'loudness', 'mode', 'speechiness', 'acousticness', 'instrumentalness', 'liveness', 'valence', 'tempo', 'duration_ms', 'time_signature']

def encode(row):
    return np.array([
        (row[k] - tracks_with_features_df[k].min())
        / (tracks_with_features_df[k].max() - tracks_with_features_df[k].min())
        for k in encode_fields])

tracks_with_features_encoded_df = tracks_with_features_df.assign(
    encoded=tracks_with_features_df.apply(encode, axis=1))
tracks_w_features_encoded_product = tracks_w_features_encoded.assign(temp=0) \
    .merge(tracks_w_features_encoded.assign(temp=0), on='temp', how='left').drop(columns='temp')

tracks_w_features_encoded_product = tracks_w_features_encoded_product[
    tracks_w_features_encoded_product.id_x != tracks_w_features_encoded_product.id_y]

tracks_w_features_encoded_product['merge_id'] = tracks_w_features_encoded_product \
    .apply(lambda row: ''.join(sorted([row['id_x'], row['id_y']])), axis=1)

tracks_w_features_encoded_product['distance'] = tracks_w_features_encoded_product \
    .apply(lambda row: np.linalg.norm(row['encoded_x'] - row['encoded_y']), axis=1)
Most similar songs
After that I was able to get most similar songs/songs with the minimal distance, and it selected kind of similar songs:
tracks_w_features_encoded_product.sort_values('distance').drop_duplicates('merge_id') \
    [['artists_x', 'song_title_x', 'artists_y', 'song_title_y', 'distance']].head(10)
| artists_x | song_title_x | artists_y | song_title_y | distance |
|---|---|---|---|---|
| Florence + The Machine | The End Of Love | Glass Animals | Gooey | 0.011732 |
| The Stone Roses | Love Spreads | The Stone Roses | Love Spreads | 0.038285 |
| OK Go | Here It Goes Again | The Jesus and Mary Chain | Some Candy Talking | 0.108457 |
| The Libertines | Can’t Stand Me Now | Foo Fighters | Monkey Wrench | 0.117521 |
| AC/DC | Thunderstruck | Muse | Starlight | 0.141387 |
| Marilyn Manson | The Nobodies | Foo Fighters | My Hero | 0.147820 |
| Pulp | Something Changed | Ween | Mutilated Lips | 0.158513 |
| Blur | My Terracotta Heart | Men I Trust | Tailwhip | 0.161328 |
| Talking Heads | Road to Nowhere | HAIM | The Steps | 0.162264 |
| Halestorm | Bad Romance | Dodgy | Good Enough | 0.162886 |
Suprisely makes sense!
Most average songs
i.e. the songs with the least distance from every other song:
tracks_w_features_encoded_product \
    .groupby(['artists_x', 'song_title_x']) \
    .sum()['distance'] \
    .reset_index() \
    .sort_values('distance') \
    .head(10)
| artists | song_title | distance |
|---|---|---|
| The Animals | We Gotta Get Out Of This Place | 758.802868 |
| Tenacious D | Fuck Her Gently | 761.310917 |
| Arctic Monkeys | Do I Wanna Know? | 767.353926 |
| One Direction | Story of My Life | 773.588932 |
| Urge Overkill | Girl, You’ll Be a Woman Soon | 775.938550 |
| alt-J | Tessellate | 783.974366 |
| Guns N’ Roses | Knockin’ On Heaven’s Door | 786.414124 |
| alt-J | Breezeblocks | 787.258564 |
| Divinyls | I Touch Myself | 787.683498 |
| Tears For Fears,Dave Bascombe | Head Over Heels - Dave Bascombe 7” N.Mix | 789.882583 |
Most ‘So not me’ songs
| artists_x | song_title_x | distance |
|---|---|---|
| The Stone Roses | Love Spreads | 1859.548582 |
| Piano Dreamers | Heaven’s Gate | 1504.676314 |
| Per-Olov Kindgren | After Silence | 1406.159590 |
| Men I Trust | All Night | 1348.317181 |
| MONO | Ashes in the Snow - Remastered | 1324.674595 |
Next
I’ll use cluster to bucket my favorite tracks when I get really bored.

Since you made this far
How do you find good music you’ve never heard before?
Try this gem I recently found… www.gnoosic.comyou put in three of your favorite bands/artists, and it will recommend similar stuff that you most likely haven’t listened to.
And then you will come back and thank me. You are welcome!
Stay safe.