What happened if the sample size is very large?
Too large of a ... good thing?

Risk of a large sample size
Typically we don’t worry about sample size being too large, because that means we have more power, we can detect smaller effect with more significance.
It’s not a problem because of technical reasons but human motivation and interpretations.
Warning: Huge Samples Can Make the Insignificant…Significant
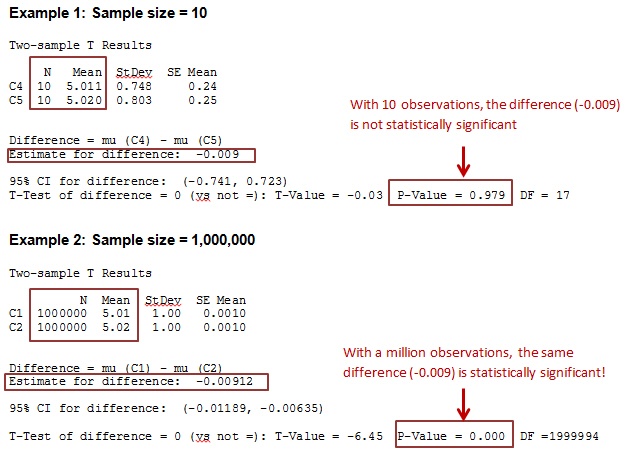
When sample size is too large, unless the effect is truly not there, unless the coefficient is truly zero, it doesn’t matter how small the beta is, we will find it significant. If we have sufficient data, even the smallest possible effect will be captured. (A insignificant result will be significant if we multiply sample size by 10).
Risk of that
People put too much intention on p-value / significance (the number of stars) without and forget whether the coefficient/magnitude of coefficient is meaningful, practically significant, or how large / small the effect is (the value of coefficient). It is hinten on the issue of large sample size.
At the end of the day, when we implement the causal inference solution, it may not improve the outcome by that much because we are chasing something mynute.
Solution
Always report not only the significance level but also what exactly the estimate is.
Example
Look at the 2-sample t-test results shown below. Notice that in both Examples 1 and 2 the means and the difference between them are nearly identical. The variability (StDev) is also fairly similar. But the sample sizes and the p-values differ dramatically:

Power and sample size calculation for t test in R
We know how to compute power and determine sample size for Normal (z) tests and confidence intervals. It’s a bit harder to do that by hand for a t distribution, but there is a powerful R function we can use, called power.t.test() that makes it easy.
To use it, we need to know (or at least guess) a few things. We can give R values for all but one of several quantities, and R can determine the missing one for us.
Suppose we want to know the power that a t-test has for detecting a difference as large as 1 unit from zero if the standard deviation is 3 units, we have a sample of n = 20, and we are testing with alpha = .05
power.t.test( 20 , 1 , 3 , .05 , NULL , type = "one.sample" )
 One-sample t test power calculation

              n = 20
          delta = 1
             sd = 3
      sig.level = 0.05
          power = 0.2931601
    alternative = two.sided
So we have only a 29% chance of detecting en effect that size.
How large a sample would we need to have power .8?
power.t.test( NULL , 1 , 3 , .05 , .8 , type = "one.sample" )
 One-sample t test power calculation

              n = 72.58407
          delta = 1
             sd = 3
      sig.level = 0.05
          power = 0.8
    alternative = two.sided
We need 73 (round up) to be reduce the Type II error risk to 20%.
How large an effect could we detect with 80% power with out original sample size?
power.t.test( 20 , NULL , 3 , .05 , .8 , type = "one.sample" )
   One-sample t test power calculation

              n = 20
          delta = 1.981323
             sd = 3
      sig.level = 0.05
          power = 0.8
    alternative = two.sided
About 2 units (2/3 of a standard deviation).
It also works for a two-sample problem; the default is actually the two-sample case.
Suppose we want to detect a 1-unit difference in means between groups with standard deviation 3 in both groups, again we assume alpha = .05 and want power .8.
power.t.test( NULL , 1 , 3 , .05 , .8 )
 Two-sample t test power calculation

              n = 142.2466
          delta = 1
             sd = 3
      sig.level = 0.05
          power = 0.8
    alternative = two.sided

NOTE: n is number in *each* group
We can detect effects no smaller than about .9 standard deviations under those conditions.
