
Swimmer Performance vs Lane Placement Analysis
Causal inference case using Matching

Introduction
Unfair Competitive Advantage
When watching competitive swimming, it seems like the swimmers in the middle lanes always win the race. Although this is partly by design, as the fastest qualifiers are placed in the innermost lanes, there is great debate amongst the swimming world whether there is additional advantage unintentionally given to these swimmers. In this project, we hope to address whether lane placement leads to an unfair competitive advantage.
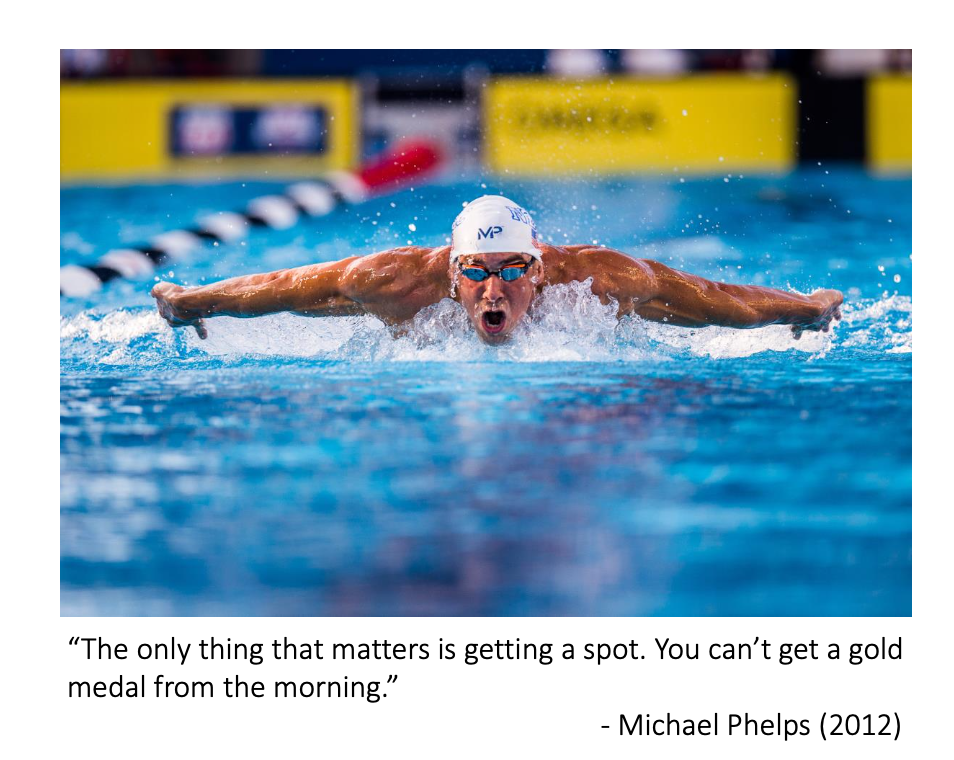
To illustrate this notion, take the example of Michael Phelps, widely regarded as the greatest swimmer of all time. In the 2012 Olympic Games, Phelps barely qualified for the finals of the 400 IM. As the slowest qualifier, he was placed in one of the outermost positions, lane 1. Unphased, Phelps didn’t think much of it. “The only thing that matters is getting a spot” he rationalized, “you can’t get a gold medal from the morning.” In retrospect, it’s understandable that Phelps was this confident despite having the slowest prelims time amongst qualifiers; he was, after all, the reigning gold medalist and world record holder in the event. However, he was not able to defend his title when swimming from an outside lane. As a matter of fact, he failed to medal at all, placing 4th in the event and adding over 5 seconds to his time from the prior Olympics. To put this in perspective, out of the 30 Olympic events that Phelps swam, the only other time he didn’t medal was at the age of 15.
Although this example gives some credence to the claim that lane placement may affect performance, it is quite anecdotal. In our study, we will use real competition data to assess the effect of lane placement on performance.
Possible Reasons of the Effect
Before we begin our analysis, it is important to establish some intuition as to why an effect may be plausible.
First, there are physical reasons. Swimming in an outside lane typically means swimming with a wall directly to one side of you. When waves form, they crash off these walls and can cause turbulence or currents in the water with the greatest impact on those closest to the wall.
Next, there are psychological factors at play. Being placed in a center lane implies that you are a favorite to win the heat whereas swimmers in the outside lanes are expected to finish last. Mentally, this could go two ways.
Lastly, there are visual reasons that lane advantages could exist. Because they are swimming against a wall, swimmers in outside lanes do not have a clear view of their competition. As a matter of fact, they can only see competitors to one side of them and are multiple lanes away from the top seeded swimmers. In contrast, swimmers in the inside lanes can see other top competitors right next to them on either side. It’s possible that this could affect pacing significantly.
Ideal Experiment
In order to determine the effect of lane placement conclusively, we would ideally conduct an experiment. This would involve gathering a sufficiently large group of swimmers, randomly assigning them to inside or outside lanes, subjecting both groups to the exact same preparation (e.g. bedtime, wake-up time, meals, warm-up, etc.), and having the swimmers race, recording the times.
Then, results of the swimmers in inside and outside lanes could be compared to estimate an effect. Alas, we had neither the time nor the resources to conduct a proper experiment. Instead, we will be performing an observational study.
Data Overview
The data used for our analysis comprises of meet results from conference championship meets in the California Community College Athletic Association between 2017 and 2019, scraped from SwimPhone.com. Each meet included in our dataset took place at the end of the season in either April or May, was swam in an 8 lane pool, and follows the same championship meet format with prelims of an event in the morning and the top 16 qualifiers racing again in the evening for finals. To simplify our analysis, we restrict the scope to events of 100 yards, the most common distance. Each unit of observation is a finalist in a specific event. The dependent variable we will be modeling is the finals time while the treatment is the lane placement in finals. Lanes 4 and 5 are considered inside lanes while lanes 1 and 8 are considered outside lanes. Other covariates included are the prelims time, the improvement from seed time to prelims time, the gender of the swimmer, and the stroke of the event.
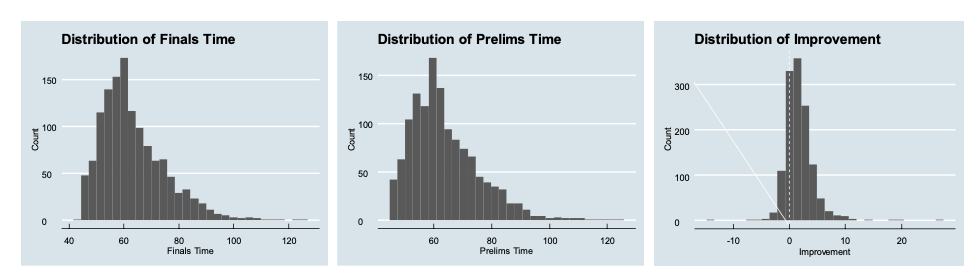
Figure 1: Continuous Data Distributions
When examining the distributions of the time variables (Figure 1), there are several characteristics of note. It appears that both prelims time and finals time follow similar right skewed distributions.
Most of the data is around 60 seconds with a few observations reaching 80 or even over 100 seconds but no extreme outliers. Additionally, the finals time seems to be slightly more concentrated at lower values. The time improvement from seed to prelims is centered above 0, indicating that most finalists improved upon their in-season seed time in prelims. This distribution is fairly symmetric with some outliers gaining more than 10 seconds or improving by over 20 seconds.

Figure 2: Discrete Data Distributions
Looking at the distributions of categorical variables (Figure 2), we see some interesting characteristics. As the data collected consists of the 100 yard races of each stroke across 22 meets, it is unsurprising that gender is quite evenly distributed.
However, the distributions of stroke and lane are somewhat unexpected. Because there was an equal number of events scraped for each stroke, we would expect a balanced number of observations for each stroke. The dominance of freestyle in our dataset implies that swimmers were more likely to scratch out of finals in non-free strokes or some events did not have enough participants to fill two finals heats.
Similar rationale might explain why our dataset is weighted more heavily towards inside lanes. Those who are expected to finish last in their heat may be more likely to scratch the event or, since lanes are seeded progressively slower towards the outside, events without enough participants for two full heats would result in empty outside lanes.

Figure 3: Relationships Amongst Variables
To better understand the variables that will be used in our analysis, we examined some relationships present (Figure 3).
Intuitively, a swimmer’s performance in prelims is a very strong indicator of his or her performance in finals, as indicated by a nearly perfect correlation between the two times. In addition, we see that male swimmers’ times are typically faster and less varied than those of female swimmers. In terms of strokes, it’s evident that freestyle is the fastest stroke with the least variance, followed by butterfly, backstroke, and breaststroke, in that order. Now that we have a clearer picture of the data that we will be using, we can conduct our analyses.
Main Analysis
Naïve Regression
Before applying any econometric techniques to make causal inference in an observational setting, we ran a naïve regression model regressing finals time on prelims time, stroke, gender, time improvement, and lane. However, as discussed previously, lane placement for finals is not randomly assigned and there is clear endogeneity present. Therefore, we are unable to imply causality in our interpretation of the treatment effect. Results of this regression are shown below (Table 1). To be concise, insignificant predictors are excluded from this discussion.
| Variable | Estimate | p-value |
|---|---|---|
| Prelims Time | .9847 | < 2e-16 |
| Improvement | .1447 | < 2e-16 |
| Lane (Treatment) | .2830 | .000215 |
Table 1: Naïve Regression Results
We observe that for a one second increase in a swimmer’s prelims time, we would expect his or her finals time to increase by .9847 seconds, holding all other variables constant. Unsurprisingly, this indicates that swimmers are typically faster in finals heats than in prelims heats. Next, we can see that for each additional second of improvement between seed time and prelims time, we expect an increase in finals time by .1447 seconds, holding all else constant. Again, this makes sense. Swimmers who have improved significantly from their seed time likely do not have more effort to give for further improvement, whereas those who did not improve greatly from their in-season time may have more to give in finals. Next, we observe that swimmers in outside lanes swim, on average, .2830 seconds slower in finals than those in inside lanes, all else equal.

Figure 4: Covariate Imbalance Before Matching
As alluded to before, since treatment groups are not randomly assigned, we see significant differences between the two groups (Figure 4). Because lane placement is determined by prelims time, we see that swimmers in inside lanes are an average of around 5 seconds faster than those in outside lanes. Additionally, those in outside lanes had an average improvement in prelims of about half a second more than those in inside lanes. Last but not least, if the groups were truly similar, they should have a nearly identical distribution of propensity scores. A propensity score is a measure of the predicted probability of being placed in an outside lane based on all other factors. Intuitively, it can be thought of as a measure encompassing all covariates such that two observations with the same propensity score would have virtually the same characteristics. As we can see in the graphs above, it’s clear that this observational data cannot be treated like a randomized controlled trial.
Propensity Score Matching
To address this non-random lane assignment, we employed an econometric technique called propensity score matching. This method finds swimmers in outside lanes with very similar propensity scores to swimmers placed in inside lanes and matches them. Those without a good match are discarded. The resulting dataset should eliminate covariate imbalance and recover treatment assignment as good as random, post hoc.

After matching, it is evident that the characteristics of swimmers in outside and inside lanes are much more similar. Statistical tests confirm that there are not significant differences between the two groups in prelims time or time improvement. Moreover, we can see that the distribution of propensity scores is essential identical between those placed in inside or outside lanes. Now that we have obtained a dataset that simulates a randomly assigned treatment, we can refit a regression model of finals time based on prelims time, stroke, gender, time improvement, and lane placement. Results of this model are shown below (Table 2).
| Variable | Estimate | p-value |
|---|---|---|
| Prelims Time | .9945 | < 2e-16 |
| Improvement | .1347 | 1.25e-11 |
| Lane (Treatment) | .3342 | .000114 |
Table 2: Matched Regression Results
The significant predictors and estimates are quite similar to those before matching. Here, we see that for each additional second of time in prelims, we expect the time in finals to increase by .9945 seconds, holding all other variables constant. Again, we observe an expected increase in finals time of .1347 seconds for each incremental second of improvement from seed to prelims while controlling other predictors. Finally, we are able to estimate the effect of lane placement. All else equal, we estimate that swimming in an outside lane increases time by .3342 seconds. For reference, the difference between 1st place and 4th place of the men’s 100 meter freestyle in the 2016 Olympics was .30 seconds.
Conclusion
Policy Implications
Recall the three reasons we may see an effect of lane placement upon performance (physical, psychological, visual). Barring a radical redesign of the competition pool, we can only address two of these potential reasons: physical and mental factors.
To combat the physical disadvantages of swimming in an outside lane, we first recommend ensuring that high level competitions have buffer lanes on the outside. This is already done in many top competitions. By having an extra lane against the wall, competitors will no longer be subject to waves crashing against the wall.
In addition, there are a couple pool design characteristics that should be considered. There are gutters and lane lines that are specifically designed to disperse turbulence in the water. Investment in these technologies can help ensure that nobody is given an unfair advantage. Also, pools of greater depth reduce the likelihood of currents forming. This should be taken into consideration when building new competition pools. To address psychological factors that impair swimmers in the outside lanes, we propose random assignment of lanes to finalists. This could help eliminate the stigma and expectation of losing the race simply because of lane placement.

Limitations
There are several threats to causal inference that may bias our estimates.
First, there is significant selection bias as we use a convenience sample. Since we are simply using data that was easily accessible, we do not have a random sample and it may not necessarily be representative of all competitive swimmers. Because of this, our findings may not generalize.
Next, the key assumption of matching is that lane placement is fully determined by observed variables. Although lane placement is directly based on prelims time, there are a number of omitted variables that may affect both finals time and treatment. Unobservable characteristics such as energy level, motivation, and strategic decisions may all influence performance in prelims (and therefore, lane placement) and finals. Another variable we do not capture is the quality of competition swimsuit. Swimmers who are confident they will qualify for finals may save a faster suit for finals, biasing their speed in prelims and lane placement.
Lastly, amount of competitive experience and age may be related to lane placement and performance.
From a more technical perspective, the functional form of logistic regression used for matching is quite arbitrary. However, sensitivity analyses varying functional form, matching algorithm, parameter values, and model specifications show our results are quite robust.
Finally, we are unable to account for differing lanes in the prelims swim. When including this as a covariate, we would essentially be estimating the treatment effect of lane placement twice. This would lead to a difficult to interpret and fairly unreliable estimate.
Reference
-
Various articles referenced in the introduction section.
- https://www.wsj.com/articles/did-the-olympic-pool-give-some-swimmers-an-advantage-1471470741
- https://www.washingtonpost.com/news/wonk/wp/2016/09/01/these-charts-clearly-show-how-some-olympic-swimmers-may-have-gotten-an-unfair-advantage/
- https://qz.com/761280/researchers-believe-certain-lanes-in-the-olympic-pool-may-have-given-some-swimmers-an-advantage/
- http://www.bbc.co.uk/newsbeat/article/37083059/are-there-lane-advantages-in-athletics-swimming-and-track-cycling
-
All data used for analysis was retrieved via SwimPhone.com from CCCAA meets.
-
Olympic swimming data was provided by Sports Reference.